Microphone De-Essing and De-Popping
About This Guide
This document contains instructions for processing microphone signals to handle common problems associated with sibilance and pops.
De-Essing
A common complaint of microphone recordings is that the sibilant sounds (e.g. “s”, “z”, and “sh”) are too prominent and harsh. This is because the microphone is very close to the talker and picks up more of these high frequencies.
The problem area is in the range from 4 kHz to 10 kHz and depends on the talker. A fairly common frequency to concentrate on is around 8 kHz. An overview of the problem and approaches can be found at:
Audacity’s “Spectrogram” view shows sibilance as a broad band of energy above roughly 4 kHz in this example.
Broadband De-Essing
In the broadband approach the entire signal level is reduced when harsh high frequencies are detected. A standard AGCLimiterCore can be used with a side-chain EQ which accentuates the 8 kHz problem frequencies. The downside of this approach is that when sibilants are detected the gain of the entire signal is reduced; this is not ideal.
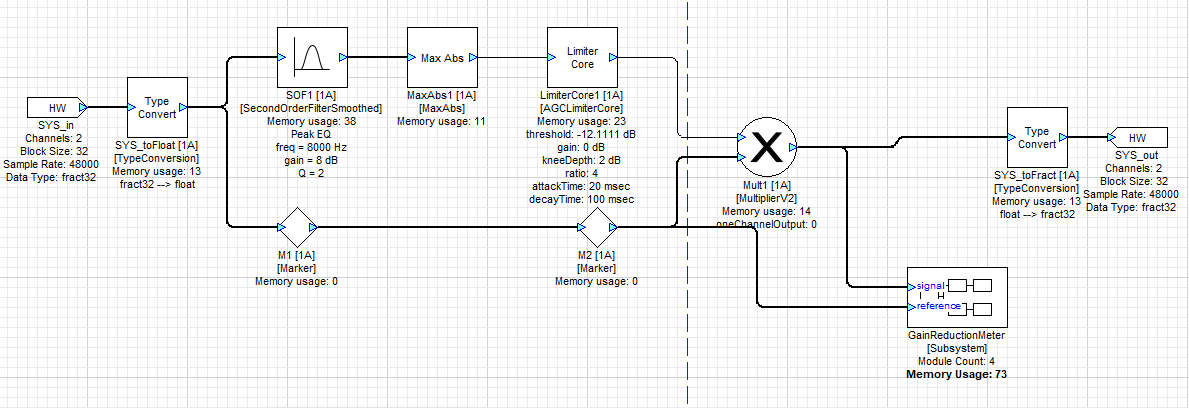
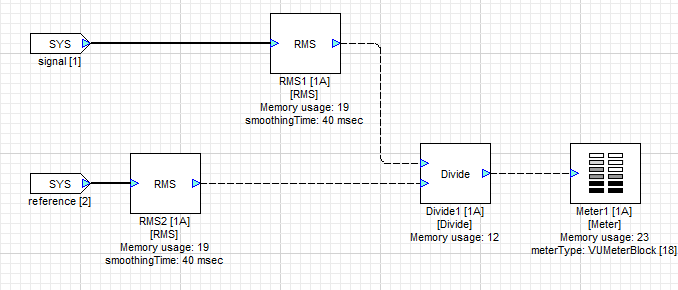
A GainReductionMeter subsystem has been added which lets you visualize the action of the limiter circuit. This is optional and can be eliminated after system tuning.
Tuning the Layout
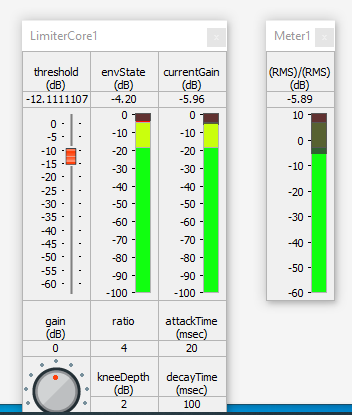
Open the Meter Meter1 in the GainReductionMeter subsystem, then open the LimiterCore1 module’s inspector. Start by adjusting the threshold slider and checking the volume difference on Meter1. When there is no volume difference, the meter will show “0 dB”.
You may also wish to adjust the attack and decay times of the LimiterCore1 module.
You can also adjust SOF1’s settings to set the range of frequencies which will trigger the gain reduction.
Split Band De-Essing
One improvement is to use a crossover and treat sibilant and non-sibilant frequencies separately. A 2-way crossover with a cutoff frequency of 6 kHz is used. A limiter then acts on the high-frequency signals and reduces the gain, if necessary; the low frequencies are untouched.
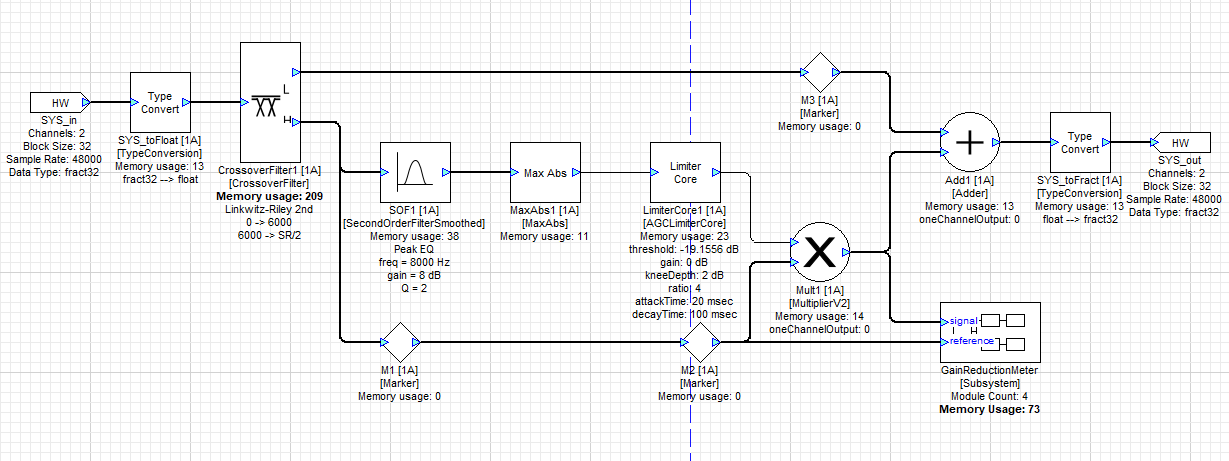
Tuning the Layout
Open the Meter Meter1 in the GainReductionMeter subsystem, then open the LimiterCore1 module’s inspector. Start by adjusting the threshold slider and checking the volume difference on Meter1. When there is no volume difference, the meter will show “0 dB”.
You may wish to adjust the attack and decay times of the LimiterCore1 module.
You can adjust SOF1’s settings to set the range of frequencies which will trigger the gain reduction.
Set the crossover frequency of CrossoverFilter1 to fine-tune the affected frequency ranges.
Dynamic Equalizing De-Essing
It is still possible to do better. In Split Band De-esssing, all signals above 6 kHz are reduced in gain if sibilants are detected. The design below uses a controllable-gain SOFControlV2 module to zero in on the desired frequencies. A bandpass filter at 8 kHz detects sibilants.
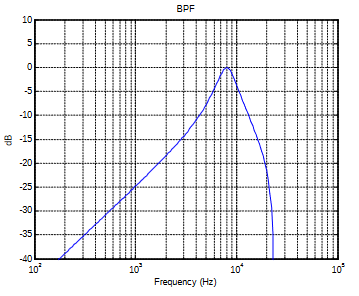
The output of the bandpass filter drives a limiter core and this in turn reduces the gain of the high-pass output from the crossover module. This limits the gain reduction to the range of frequencies from 6 to 10 kHz. The entire system is shown below:
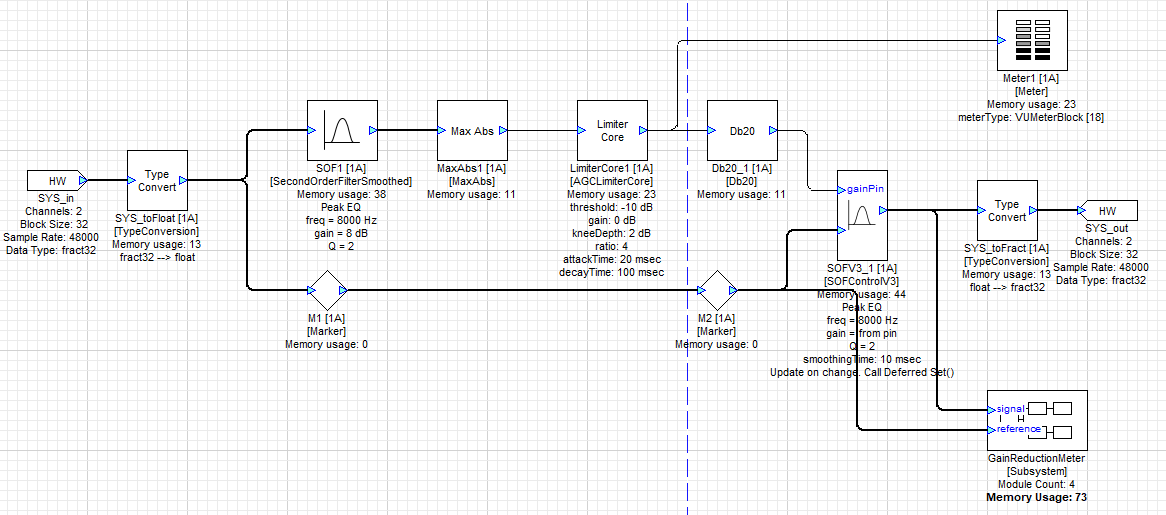
dynamic_equalizing_de-essing.awd
Tuning the Layout
A separate Meter has been added to the output of the LimiterCore1 module. This lets you visualize the actual control signal which performs the gain reduction.
Open the Meter Meter2 in the GainReductionMeter subsystem, then open the LimiterCore1 module’s inspector. Start by adjusting the threshold slider and checking the volume difference on Meter2. When there is no volume difference, the meter will show “0 dB”.
You may wish to adjust the attack and decay times of the LimiterCore1 module.
You can adjust SOF1’s settings to set the range of frequencies which will trigger the gain reduction.
Set the crossover frequency of CrossoverFilter1 to fine-tune the affected frequency ranges.
Set the frequency and Q of SOFV3_1 to set the range of frequencies that will be controlled.
Note that the filter used to detect the sibilance is different from the filter that is used to control them, so you can set different values as needed to achieve best results.
De-Popping
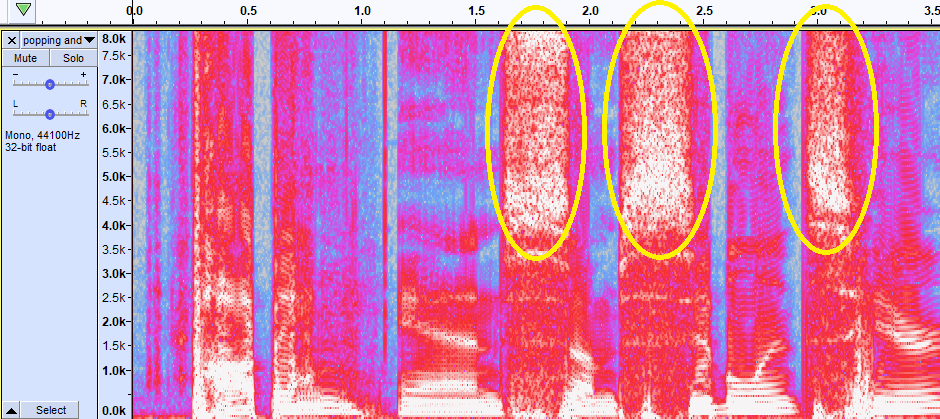
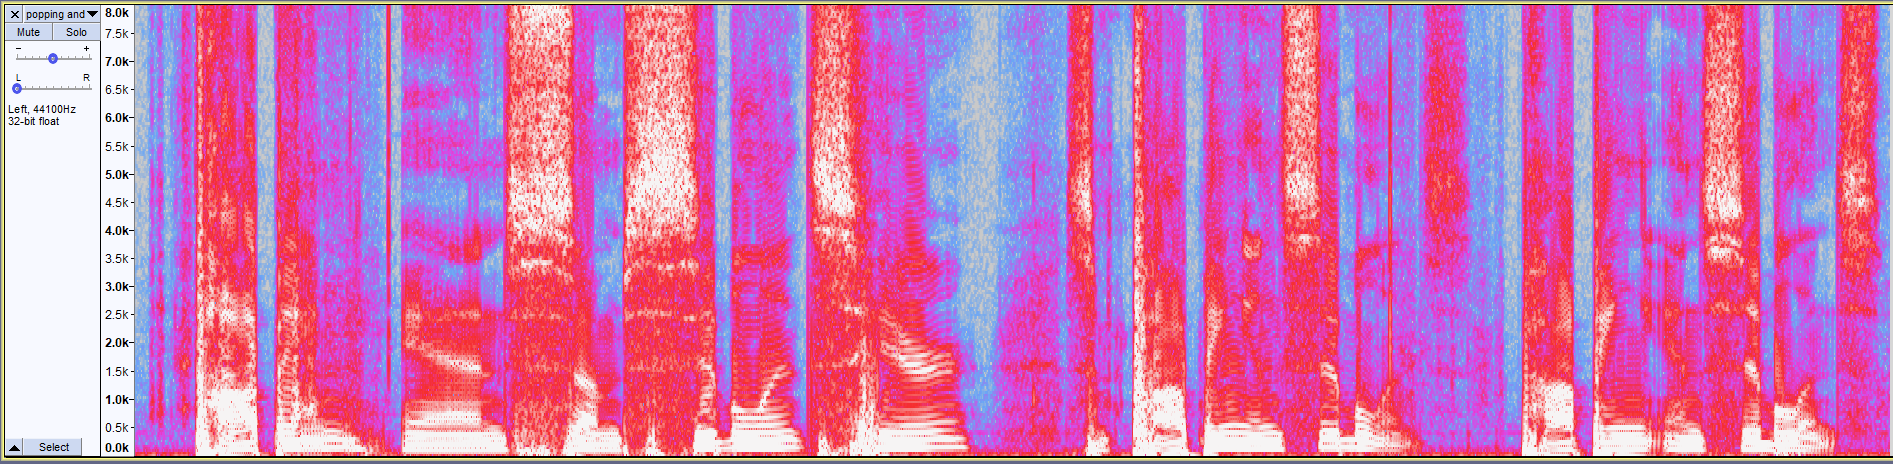
Another problem with microphones is that if the talker is too close then every plosive (a consonant with a puff of air like a “p”) causes a mini explosion. This also occurs with fixed microphones if the speaker bangs their hand on the podium or taps on the microphone enclosure. A spectrogram of a WAV file containing pops (the word “popping”) is shown below (yellow outline). A pop is characterized by a quick broad blast of energy across the spectrum. Compare that to sibilance (light green outline) which contains mostly energy above 4 kHz.
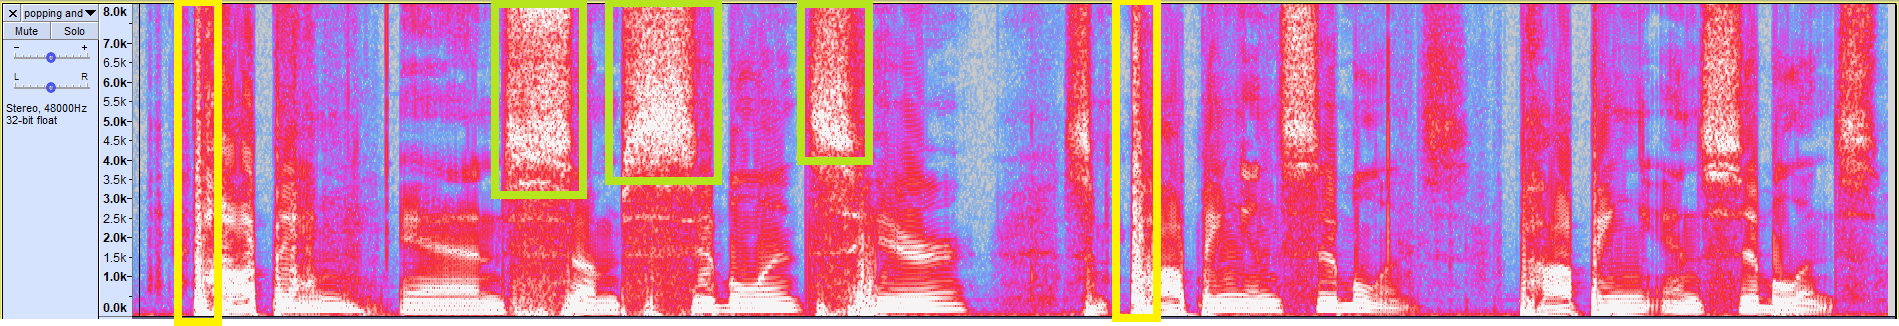
The solution to this problem is a “De-Popper” which is another form of dynamics processor. Instead of focusing on high frequencies like the De-Esser, the focus will be on low frequencies below 150 Hz.
3.1 A simple de-popper
A similar approach can be used to the de-esser, which is to isolate the frequency band containing pops using a crossover, then use the AGCLimiterCore module to control the gain of the entire band below the crossover point.
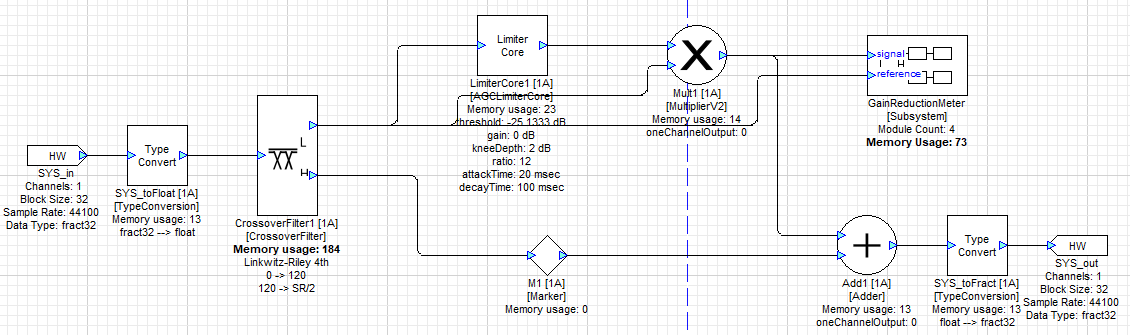
There are two drawbacks to this design:
- The crossover does not completely prevent sibilant signals from reducing the gain of the lower frequency band.
- Sustained signals below the crossover frequency can also trigger the gain reduction, even if the source was not a “pop”.
Tuning the Layout
Open the Meter Meter1 in the GainReductionMeter subsystem, then open the LimiterCore1 module’s inspector. Start by adjusting the threshold slider and checking the volume difference on Meter1. When there is no volume difference, the meter will show “0 dB”.
You may wish to adjust the attack and decay times of the LimiterCore1 module.
Set the crossover frequency of CrossoverFilter1 to fine-tune the affected frequency ranges.
3.2 A more advanced de-popper
Rather than simply using the detected level of the low frequency band to trigger the limiter, we can look for sudden increases in the low frequency energy which are more characteristic of pops and mechanical thumps.
The derivative of low frequency energy (i.e., changes in energy over time) engages the limiter only for positive slopes (signifying a sudden increase in low frequency energy). The block diagram is shown below:
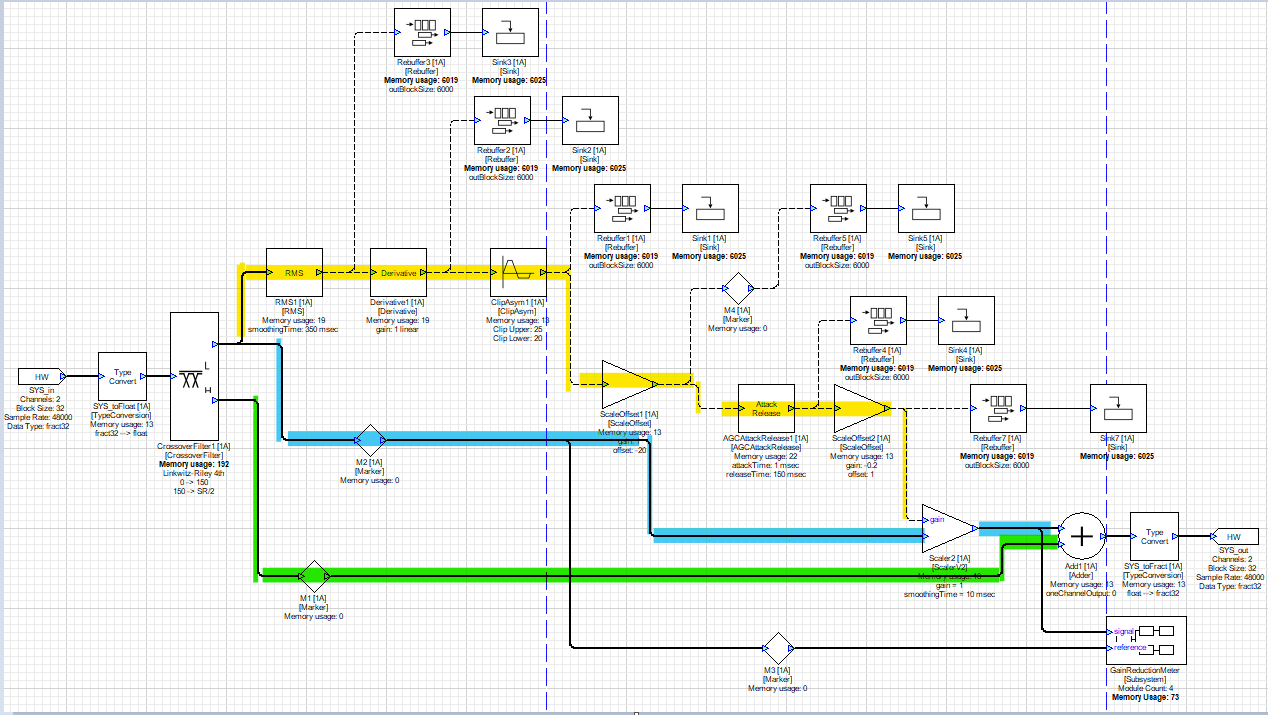
3.2.1 The audio path
Coming out of the crossover block, the audio signal is split into high and low bands at 150 Hz. The control signal path (yellow) detects pops and adjusts the gain of the low frequency audio (blue path). The high frequency path (green) passes unmodified to the adder block where it is recombined with the low frequency signal.
3.2.2 The control path
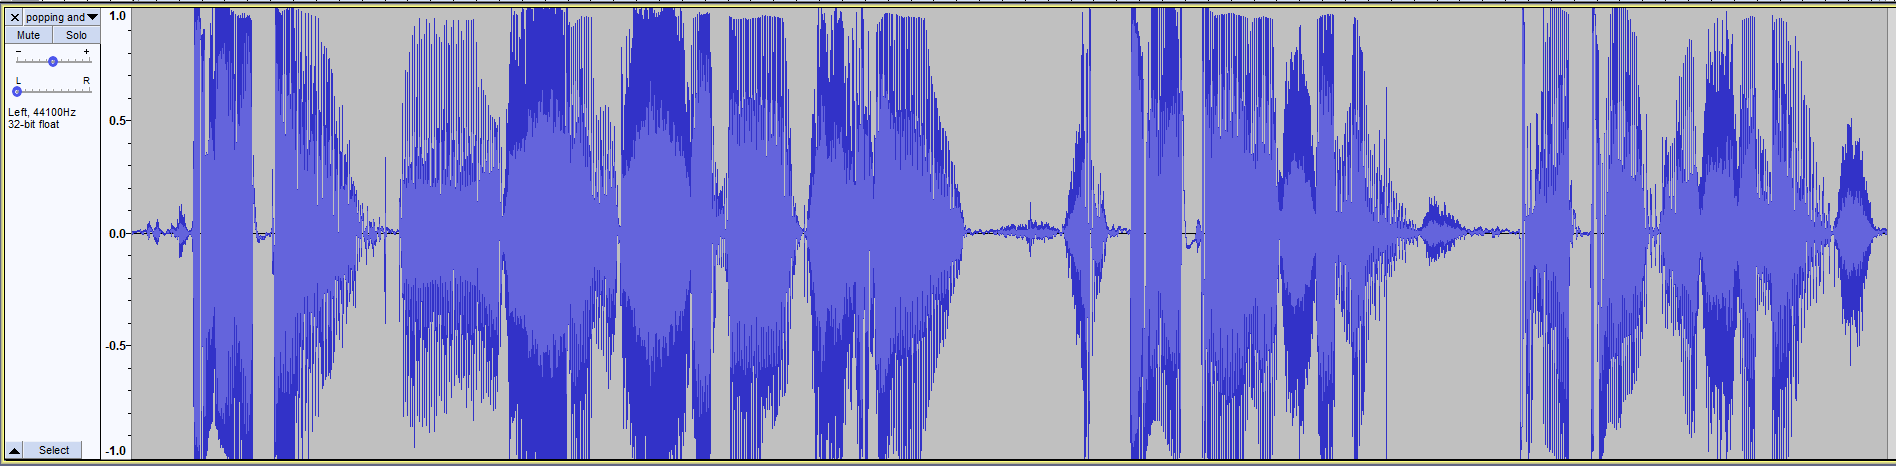
A test audio file is included which includes pops and sibilance.
Here is the waveform:
while here is the spectrogram:
Here are the various sections of the control path. In the Design, each module includes a rebuffer/sink in order to more easily visualize what is happening. The rebuffer/sink modules as well as the GainReductionMeter subsystem can be removed for production after the Design is tuned.
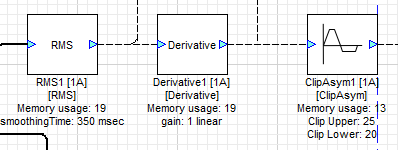
RMS
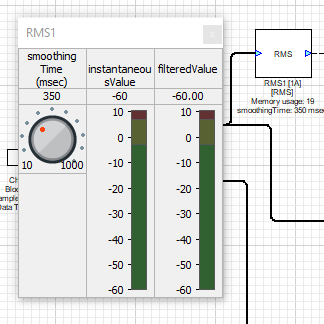
The RMS module computes the energy over an adjustable running window (the “smoothing time”).
At 100 msec smoothing time:
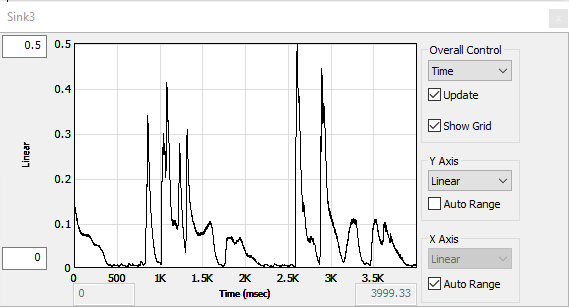
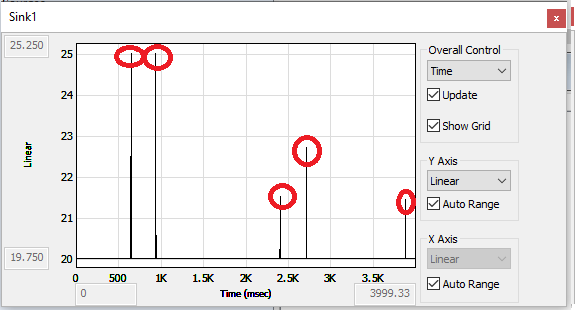
At 350 msec smoothing time (pops are circled):
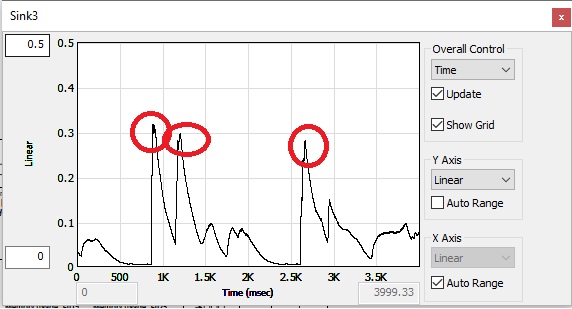
Adjust the smoothing time so that the audible pops in the signal create clearly distinguishable peaks, as shown.
Derivative
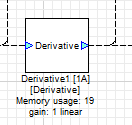
The derivative module measures the slope of the signal. We are interested in isolating the front edge of the pop signals so that we only suppress the onset of a pop. Constant low frequency energy or signals with a slower attack time shouldn’t trigger the limiter at all.
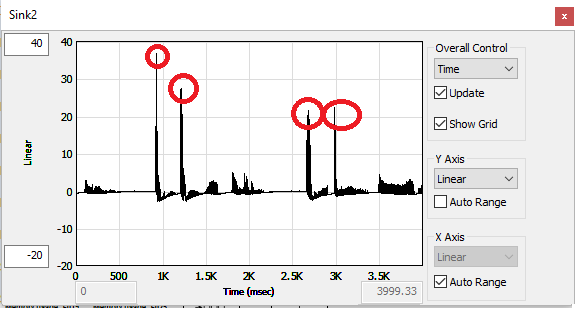
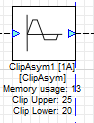
ClipAsym
We’ll use the ClipAsym module to isolate the peaks created by the Derivative module. In the display of the Derivative modules output above, we can see that the pops generate a signal above 20. So we will isolate the range of this signal between 20 and 25. The resulting spread in the control signal can be compressed (its range reduced) by reducing the span of the clipper, e.g. from 20 to 22. The tops of the peaks will simply be clipped off.

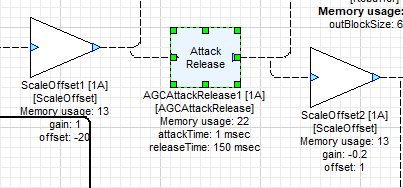
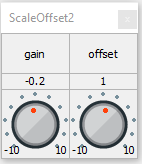
ScaleOffset
Note that the signal goes between 20 and 25. Our ultimate goal is to turn this into a gain control signal that starts at 1.0 when no pop is detected and goes down when a pop is detected. Our next step is to shift this signal so that it starts at 0 instead of 20, which is done using a ScaleOffset block with a Gain of 1.0 and Offset of -20.

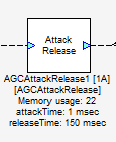
AGCAttackRelease
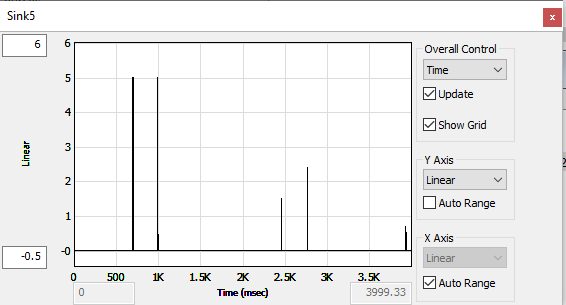
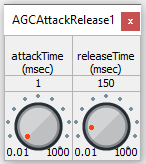
We now have some sharp spikes that have isolated the front edge of detected pops. Now we want to extend these in order to create a gain-reduction signal that will go up quickly (1 ms attack) and then decay relatively slowly (150 ms release).
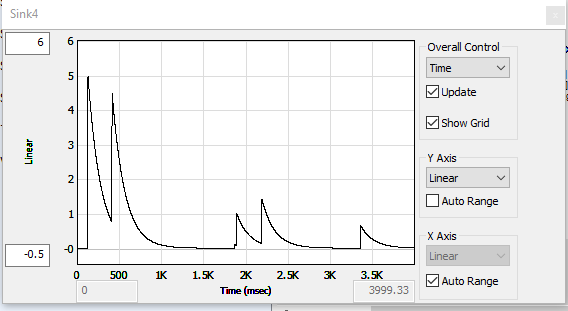
Note that the waveform is now coming up from 0. The peak value is 5.0.
ScaleOffset
The last things we need to do to the gain control signal are:
- Shift the signal from 0.0 to 1.0
- Flip the direction of the signal so that it goes DOWN with a pop, in order to reduce the gain.
- Scale the extent of the gain reduction to give the desired result.
These are all accomplished by the second ScaleOffset module.
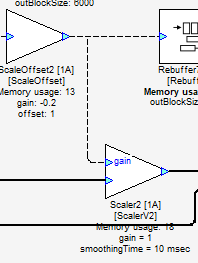
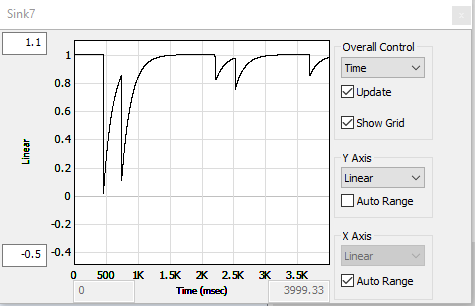
This is the control signal that feeds the Gain control pin of Scaler2, controlling the level of the low frequency band.
3.2.3 Tuning the Layout
The parameters in the table below should be adjusted to suit the needs of your system and expected input signals.
| Module | Parameter | Goal |
|---|---|---|
| RMS | Smoothing time | Create a clean signal whose peaks represent the “pops” of the test waveform. |
| ClipAsym | ClipUpper | Set the upper clipping level to isolate the pop onset and set the maximum range. |
| ClipAsym | ClipLower | Set the lower clipping level to isolate the pop onset. |
| AGCAttackRelease | Release time | Set to avoid false triggers. |
| ScaleOffset #2 | Gain | Set to adjust the maximum gain reduction. |
3.2.4 Summary
The gain control signal path is relatively complex here. The tuning approach depends on isolating the signals you wish to control, then creating a control waveform with the correct range and shape. We recommend that you perform this tuning while listening to the test waveform, to make sure you are isolating the correct parts of the waveform.